
2016 Hurricane Season Outlook
By Jon Davis, Mark Russo, Dave Margolin, & Eric Adamchick
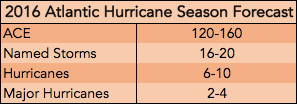
We expect this Atlantic hurricane season to feature above normal activity. In other words, Accumulated Cyclone Energy (ACE) is most likely to fall within 120-160, which compares to the 30-year normal of 108. If realized, ACE would be the highest since 2012. The majority of forecast metrics, along with the composite of our analog years, points toward a more active than normal Atlantic season. These metrics assess global ocean and atmospheric trends and the subsequent effects on Atlantic basin Sea Surface Temperatures (SSTs) and wind shear. The recent cooling of SSTs in the central and eastern Atlantic is a modest risk to our forecast on the less active side. However, we feel that the recent cooling will not be a trend throughout the entire summer, particularly across the Main Development Region (MDR) as the trade winds and associated upwelling of cooler subsurface water decreases during June and July.
Furthermore, we expect a climatological distribution of tropical cyclones across the season. Gulf storms will be most likely during June and July before the Atlantic and Caribbean ramp up in August and remain active through the remainder of the season. Hurricanes are expected to be twice as likely in the Atlantic and Caribbean as in the Gulf of Mexico. All in all, above normal activity is expected this Atlantic hurricane season, meaning there is an elevated risk to energy, agriculture, and logistics interests along the East Coast and along the Gulf Coast.
For the full report, which includes an in-depth analysis of the variables that drive this forecast, please contact us. A sample is included below.
Key Terms:
- Tropical Cyclone: The actual physical storm system that forms in the tropics. In other words, a tropical depression, tropical storm, hurricane, and major hurricane are all intensity classifications of a tropical cyclone (tropical depression is the weakest and a major hurricane the strongest).
- Named Storm: Any tropical cyclone that reaches tropical storm strength (at or greater than 39 mph sustained winds) receives a name until it dissipates.
- SSTs: Sea Surface Temperatures
- ACE: Accumulated Cyclone Energy is a metric that determines how active and the overall risk to U.S. interests during a given tropical season. ACE takes into account the frequency, strength, and duration of all tropical cyclones within a given season.
- Wind Shear: A marked difference in the speed or direction of upper atmospheric and surface winds that disturbs the vertical structure necessary for a tropical system to strengthen.The 9 highest monthly temperature departures from normal in either direction, within the 137-year historical record, all occurred in the past 9 months; all are in the warm direction
Climatology
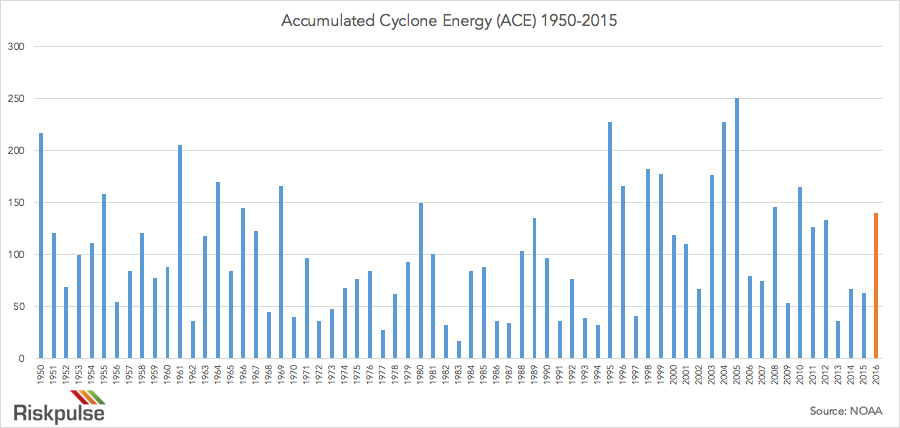
 The Atlantic Hurricane season officially kicks off June 1 and runs through November 30. This is the period of time in the Atlantic Basin, which includes the Caribbean Sea and the Gulf of Mexico, when atmospheric and oceanic conditions are favorable for, or can support tropical cyclone development. An average Atlantic hurricane season typically features approximately 11 named tropical storms, 6 hurricanes, and 2-3 major hurricanes of category 3 strength or greater. The figure above depicts the breakdown of the Atlantic basin tropical cyclone climatology from 1966-2009, and at what time of year they are most common. In other words, the sharp increase from August through September indicates the most active point in the Atlantic hurricane season and likewise when the most intense storms occur. It is also important to note that tropical cyclone activity is measured in accumulated cyclone energy (ACE), which is the measure of the frequency, strength, and duration of all tropical cyclones within a given season. This is an ideal metric to use since it provides a comprehensive assessment of the risk tropical cyclones pose to energy, agriculture, and logistics interests across the Gulf and East Coasts of the U.S. The graph below depicts the historical ACE values for the Atlantic Basin dating back to 1950, in which the current 30-year normal is 108.
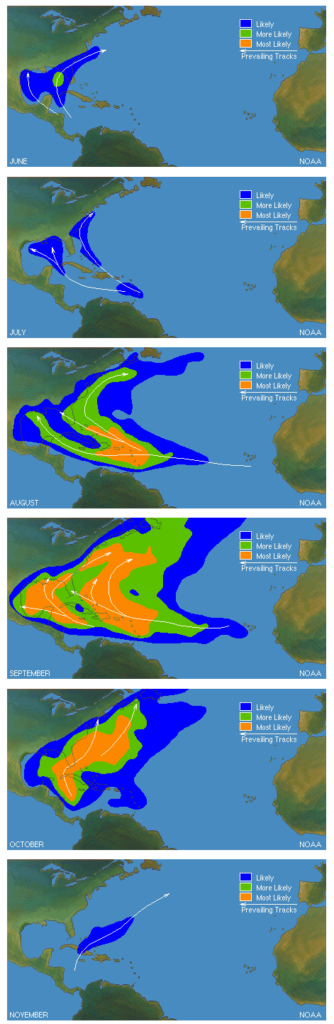 Taking a further look into the climatology of the Atlantic hurricane season, the images on the left indicate the regions where tropical cyclones are likely to form and track during each month of hurricane season. During June, tropical cyclones are typically favored in the Gulf of Mexico and the western Caribbean. This is primarily due to increased wind shear across the bulk of the Caribbean and Atlantic, which inhibits the circulation and upright structure of developing tropical cyclones. Wind shear, however, typically begins to wane in July and especially in August, when climatically the Atlantic season ramps up. This is highlighted in the figure to the right that depicts a higher probability of tropical cyclones developing in the Caribbean and tracking either up along the East Coast or into the Gulf of Mexico. These probabilities further increase in September, which historically is the most active month of the Atlantic season. The probabilities then begin to wane in the Gulf of Mexico during October, as the favored risk region for tropical cyclones shifts to the Atlantic, where it remains through November.
Forecast Foundation
Analog years provide a foundation for the seasonal forecast and we selected our analog years based on current global ocean and atmospheric trends that are likely to directly, and indirectly, impact the outcome of the Atlantic hurricane season. Included in our list of analogs years are those such as 1998, which featured the most recent marked transitions from a strong El Nino to La Nina conditions. Further, years with similar current Atlantic and global SST configurations were also included in our analog composite. Beyond the Atlantic, we examined the global oceans, as the latter can impact the overall global jet stream configuration, which modulates tropical cyclone development in the Atlantic basin. Years that followed early-March sudden stratospheric warmings were also considered. Last, we took into account the distribution of tropical convection (T-storm activity) along the equator, which can enhance or decrease wind shear (typically unfavorable for tropical cyclone development) across the Atlantic basin.
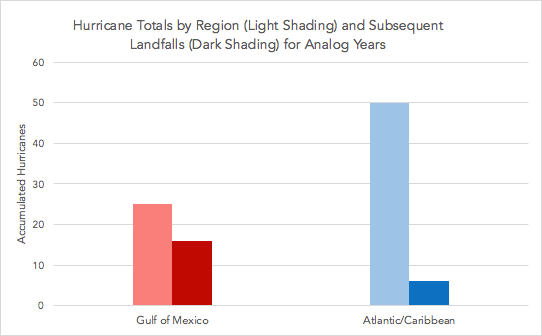 Of our nine analog years, the annual averages were 18 named storms, eight hurricanes, three major hurricanes, and an ACE value of 140 (30-year normal ACE = 108). Bottom line, the composite of our analog years points toward a more active than normal season. Of these analog years, Atlantic and Caribbean hurricanes were twice as likely as those in the Gulf of Mexico; however, approximately 60% of all Gulf hurricanes made landfall somewhere along the coast from Texas to western Florida, while only 8% of Atlantic and Caribbean hurricanes made landfall along the east coast of the U.S. Furthermore, the composite annual average of 2.8 hurricanes/year in the Gulf of Mexico is slightly less than double the 30-year normal of 1.6 Gulf of Mexico hurricanes/year. However, there is no difference in the percentage of hurricanes that make landfall between the two averages, which is approximately 60%. These results suggest that there is a heightened risk to energy, agriculture, and logistics interest in the Gulf of Mexico this year.
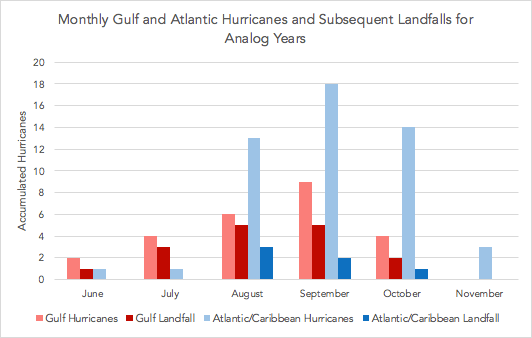
When taking a deeper look into the analog seasons, the composite distribution of hurricanes across the season does not stray far from the expected climatology. In other words, Gulf of Mexico hurricanes were favored early in the season during June and July, before the Atlantic and Caribbean become more active during August and the remainder of the season. Further, the distribution of total hurricanes was the same as climatology, featuring the pinnacle of activity in September. This is highlighted in the figure below, which shows the monthly breakdown of Gulf and Atlantic/Caribbean hurricanes and subsequent landfalls. An interesting fact is that Hurricane Sandy in 2012 was the only hurricane to make landfall along the East Coast after September in all our composite years.
2016 Atlantic Basin Forecast Metrics
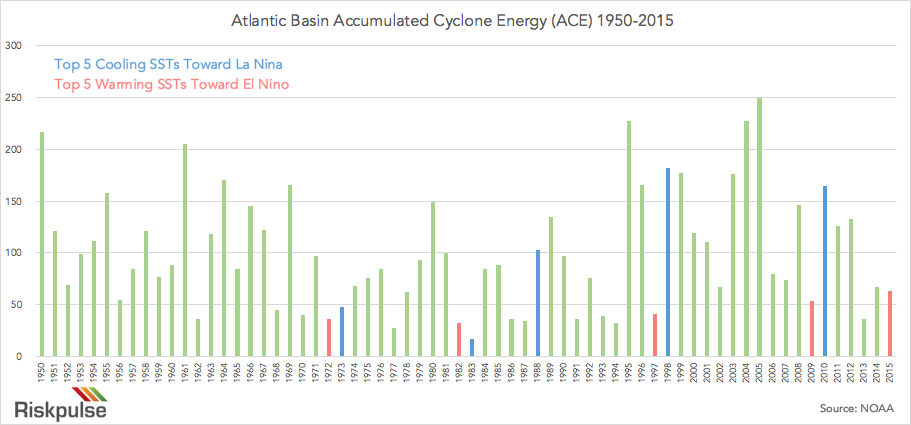
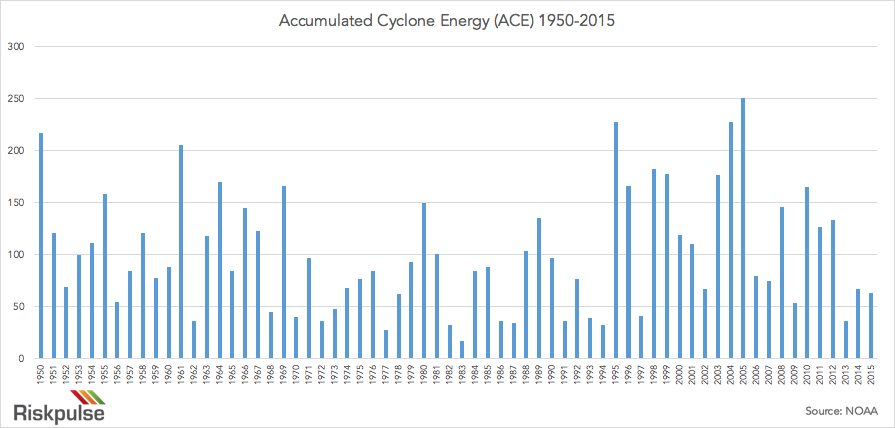
The Atlantic basin typically features more tropical cyclones during years when SSTs cool in the spring across the central and eastern equatorial Pacific. These cooling SSTs represent the transition from El Nino to La Nina. Conversely, when SSTs in the same region are warming during the spring, or El Nino conditions are growing, fewer tropical cyclones are typically observed in the Atlantic basin. This is highlighted in the graph above, which depicts the historical record of ACE dating back to 1950, where the blue years indicate the top five cooling SST years toward La Nina and the red years the top five warming SST events toward El Nino. This spring will join the top ranks of cooling SSTs years as the central and eastern Pacific has cooled markedly from the historically warm levels this past winter associated with the strong El Nino. Over the past 30 years, all similar cooling SST events in the spring have been followed by above normal Atlantic basin tropical cyclone activity the following summer and fall. All in all, the current transition from El Nino to La Nina is a data point that suggests a more active than normal Atlantic hurricane season.
![]()
Diving further into global SSTs, the above map shows the current SST anomaly distribution. In the Atlantic basin SSTs are well above normal in the Gulf of Mexico, Caribbean Sea, and western North Atlantic. The one region, however, where SSTs are not markedly above normal is in the central/eastern Atlantic between the west coast of Africa and the Virgin Islands, typically referred to as the Main Development Region (MDR). The MDR is the region where tropical cyclones tend to form and develop during the heart of the Atlantic hurricane season. SSTs in this region are currently near normal to slightly warm biased, however due to ocean circulations, adjacent warmer than normal waters, and the expectation that easterly surface winds and upwelling of cold subsurface water will decrease, the MDR is not likely to cool during the course of the summer. Furthermore, model guidance maintains slightly warm biased SSTs across the MDR during the core months of the Atlantic season. Additionally, model guidance maintains the distinct warmer than normal SSTs in the Gulf of Mexico, Caribbean, and West Atlantic into the Fall, which is consistent with the global base-state tendency toward anomalous warmth in the oceans.
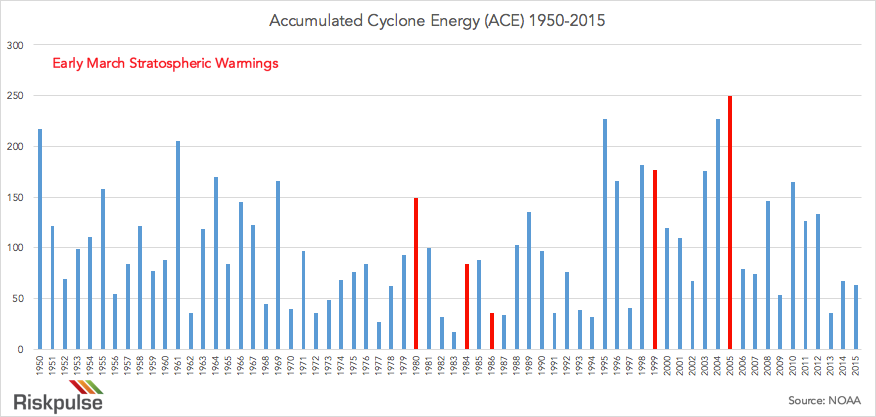
In early March of this year, the strongest sudden stratospheric warming event ever observed occurred. A sudden stratospheric warming can be thought of as a complete breakdown of the polar vortex over the Arctic. So what does this have to do with tropical cyclone activity during the summer? While difficult to justify without additional research, all previous early March sudden stratospheric warmings have been followed by anomalously active-to-near-normal Atlantic hurricane seasons (relative to their respective 30-year normals). The graph below highlights the Atlantic hurricane seasons in red that followed all other observed early March sudden stratospheric warmings. All in all, the occurrence of a sudden stratospheric warming is a considerable signal for heightened Atlantic tropical cyclone activity this year.
For the full report, which includes an in-depth analysis of the variables that drive this forecast, please contact us.
Related post

What Is a Risk Management Plan?
The Need for a Supply Chain Risk Management Plan What a year 2020 was for supply chains. No wonder more companies are going beyond supply…

Using Supply Chain Predictive Analytics to Reduce Risk
Supply Chain Predictive Analytics and Customer Service Service. It’s the difference between an average company and one that stands out from the rest. Forbes reports…

How to Mitigate Risk in The Supply Chain
The Supply Chain Risk Management Assessment A Deloitte Touche Tohmatsu survey found that 85 percent of global supply chains experienced at least one disruption in…