Call it the “Era of Extremes.” July 2023 was the hottest month ever recorded on our planet. This year promises to be the hottest year in history.
Today’s extreme weather events (floods, droughts, heat waves, wildfires/smoke, tropical storms, non-tropical storms, etc.) have been growing in frequency and magnitude for decades. As the globe heats up, these disruptive weather events increasingly delay, or even halt, the complex global network that we call the supply chain.
“There has not been a time in modern history when all parts of the climate system were in record-breaking territory.”
Here, we detail supply-chain-specific insights for 2023 and beyond to offer the best visibility into potential black swan events and other risks caused by increasingly volatile weather.
What’s causing increased weather volatility
The current state of the world, in terms of ocean and atmosphere, is unprecedented. There has not been a time in modern history when all parts of the climate system were in record-breaking territory.
The increase in disruptive weather events is directly correlated to the record increase in global temperatures – both ocean and air. Warmer oceans provide the fuel or energy for storms to become stronger and more impactful. Warmer global air temperatures increase the extent and magnitude of heat waves and droughts.
Rising ocean temperatures
Most of the globe has well above-normal ocean temperatures with some areas in the range of 3-5 degrees Celsius above normal. Currently, the most severe marine heat waves are positioned in the North Atlantic, the Mediterranean, the North Pacific, and the equatorial Pacific, where a strengthening El Niño event is in place.
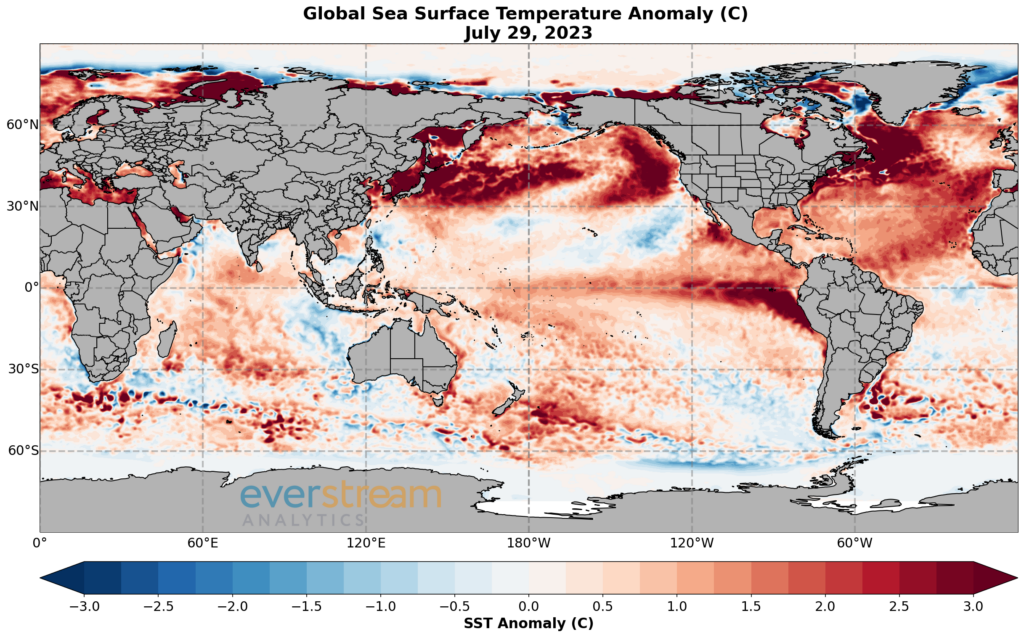
Figure 1: Current sea-surface temperature (SST) anomaly of the oceans based on a 10-year normal (source: Everstream Analytics).
The temperature of the global oceans is at the highest level ever recorded. “Ever” in this context is the past 1,000 to 2,000 years, using paleo-climatology data. Paleoclimate research uses geologic and biologic evidence (climate proxies) preserved in sediments, rocks, tree rings, corals, ice sheets and other climate archives to reconstruct past climate in terrestrial and aquatic environments around the world.
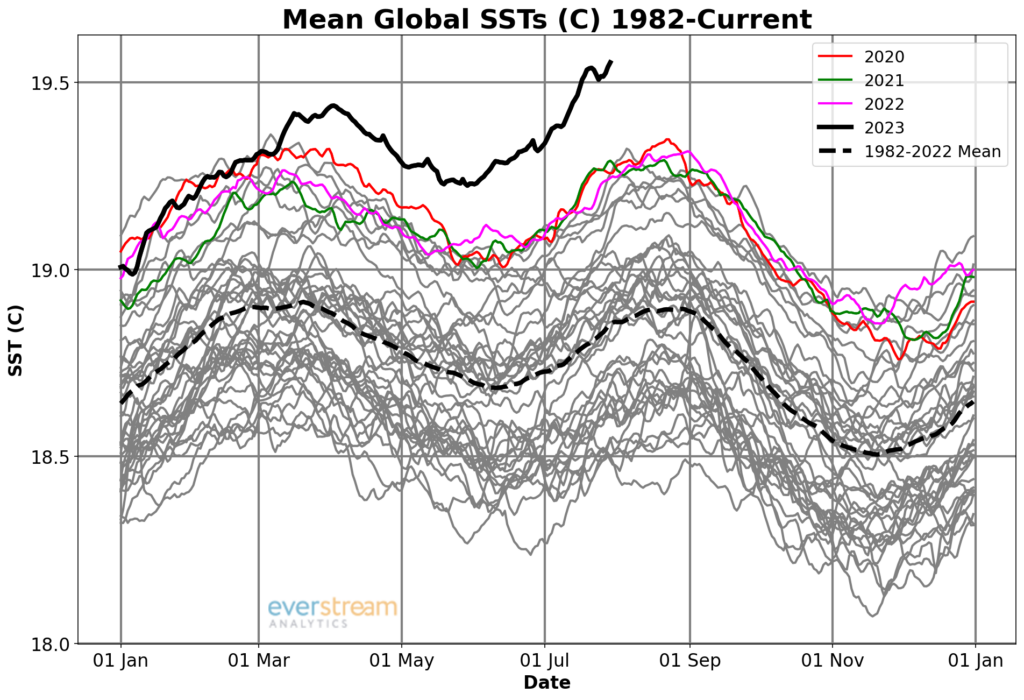
Figure 2: Daily average global SSTs during the past 40 years.
During the past three months, SSTs have risen to levels that are by far the highest on record and exceed any period in recorded history. The oceans have absorbed most of the heat in the global climate system during the past few decades.
Highest-ever air temperatures
Global air temperatures are also at their highest levels ever recorded. Globally, June was the hottest June in history, with seven countries breaking their all-time hottest June temperature including China, Vietnam, and India. That set the trend for July, which started off hot with the highest global temperatures ever recorded during the first week of July. Rome, Italy and Sanbao, China both broke national heat records.
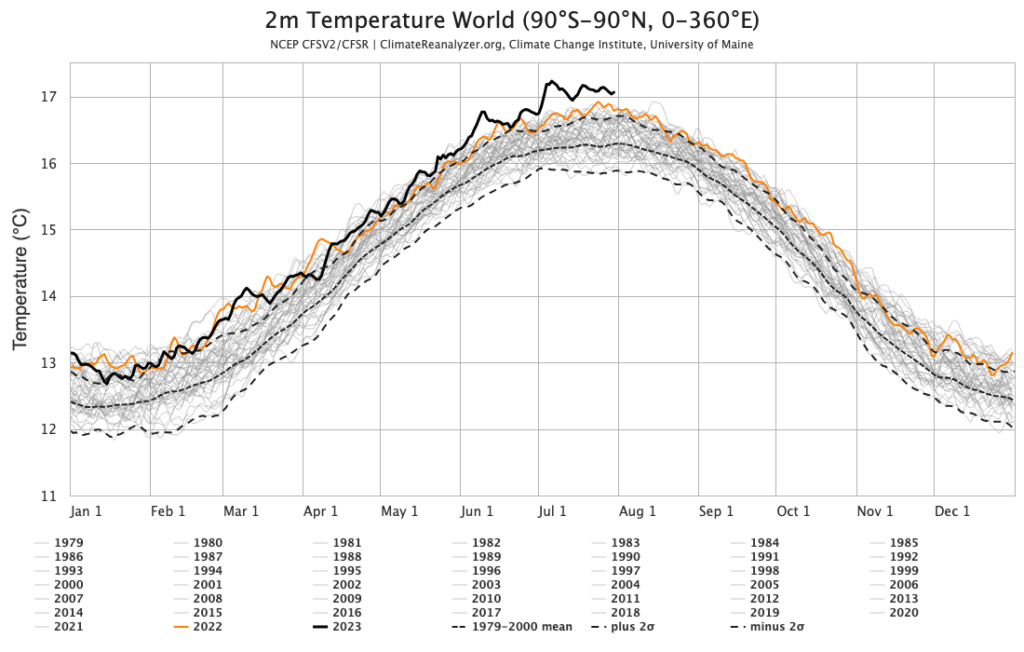
Figure 3: Daily average global temperature every year from 1979 to now (source: Climate Change Institute, University of Maine).
An average temperature of 17 degrees Celsius had never been reached until July 2023, which broke that record handily. The global temperature for most of this July has been above 17 degrees Celsius.
How supply networks are suffering
The cause and effect of the stats above is an increase in disruptive weather events – higher numbers and higher magnitude. Some of these become “black swan” events, and the impacts reverberate around the world for months or even years. The damages are high for employee health and safety, livestock health and safety, crops and global food supply, transportation, manufacturing, and more.
Costly U.S. weather volatility
In the U.S., there were 12 confirmed weather/climate disaster events during the first half of 2023, with losses exceeding $1 billion each. These events include one flooding event, 10 severe storm events, and one winter storm. Overall, these events resulted in the deaths of 100 people and had significant economic effects on the areas impacted.
By comparison, the average from 1980–2022 is only 8.1 events per year. As for the most recent five years, the average more than doubled, to 18 events. With peak hurricane season looming, it is highly likely that this year will again be above normal with weather/climate disasters in the U.S.
Worldwide weather impacts
On the global scale, there have been over 20 weather climate disaster events so far this year in the category of billion-dollar or more losses. Catastrophic flooding in northern Italy during May was the costliest, resulting in losses of nearly $10 billion. Rounding out the top five are severe weather in the U.S. in March and again in early April, and droughts in Argentina and Brazil. Also included in this list are four tropical cyclones – Mawar, Gabrielle, Freddy, and Mocha. Cyclone Gabrielle hitting New Zealand was the costliest global event at $1.8 billion while Africa’s Cyclone Freddy was the deadliest with 1,434 deaths attributed to it.
On a regional basis, there is a long list of recent extreme weather events – wildfires being the major issue. Currently more than 100,000 square km have burned in Canada this year with wildfires still burning. These fires have also affected areas around the world due to the smoke migrating into the contiguous United States and even as far away as Europe. This has caused impacts ranging from disruptions in transportation, such as airport delays, to health concerns. Recent fires in the Mediterranean caused the largest evacuation in Greece’s history when scores of out-of-control wildfires developed on the island of Rhodes.
Forecast and outlook
We expect these high volume and high-impact weather/climate events to continue through the end of 2023. These episodes of heat, regional drought, wildfires, flooding, and cyclones will continue to strain people, crops, the electric grid, and the supply chain. Further, we expect El Niño conditions to strengthen through the end of the year, enhancing regional dryness and drought in Southeast Asia and Australia.
This dryness will further stress a global food system already facing unique challenges this year. River logistics are also likely to become a more relevant issue later this year as river levels along the Mississippi and Rhine Rivers are already at low levels. Likewise, El Niño correlates to reduced rainfall across Central America, which could continue to hamper Panama Canal operations due to low water levels.
Planning for weather volatility’s new normal
It’s important to note that extreme weather events are not a short-term development. As long as the global oceans and atmosphere remain at these extraordinary levels, the Era of Extremes will continue and likely accelerate. That means more black swans are on the horizon.
The agriculture, energy, and logistics/transportation sectors are at the forefront of challenges due to extreme weather, but all operations will be impacted. Heat waves, droughts, flooding, and other extreme weather will push the limits of energy infrastructure, livestock, crops, water availability, and workers in non-conditioned spaces.
Using historical weather records to plan your operation won’t reflect this new normal. For the best visibility and earliest insight into potential black swan and other disruptive weather events, get supply chain risk focused weather forecasts specific to your operations and business priorities. AI modeling guided by applied meteorology expertise gives you earlier alerts to more specific potential risk in this new Era of Extremes.
[CTA] Learn more about climate-proofing your supply chain in our Era of Extremes webinar: Register now