Is your supply chain adapting to Climate Change?
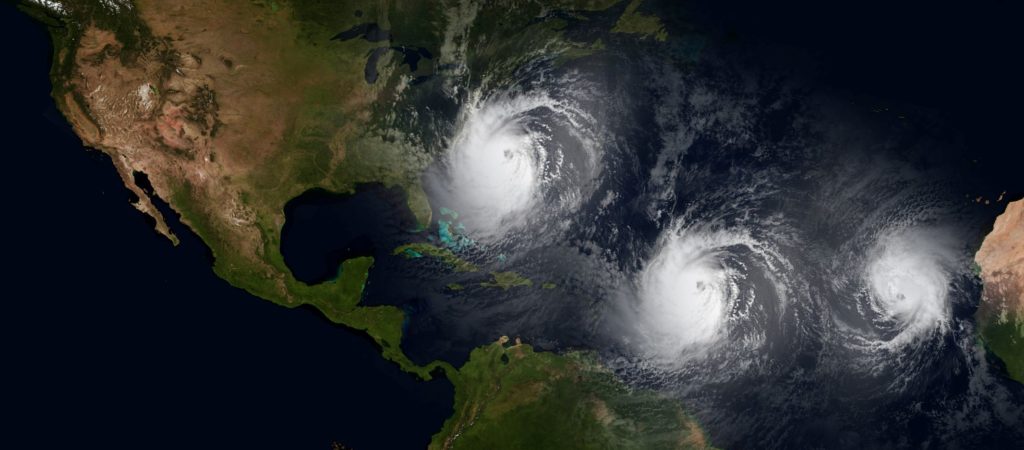
If it feels like big weather events are becoming more frequent, it’s because they are.
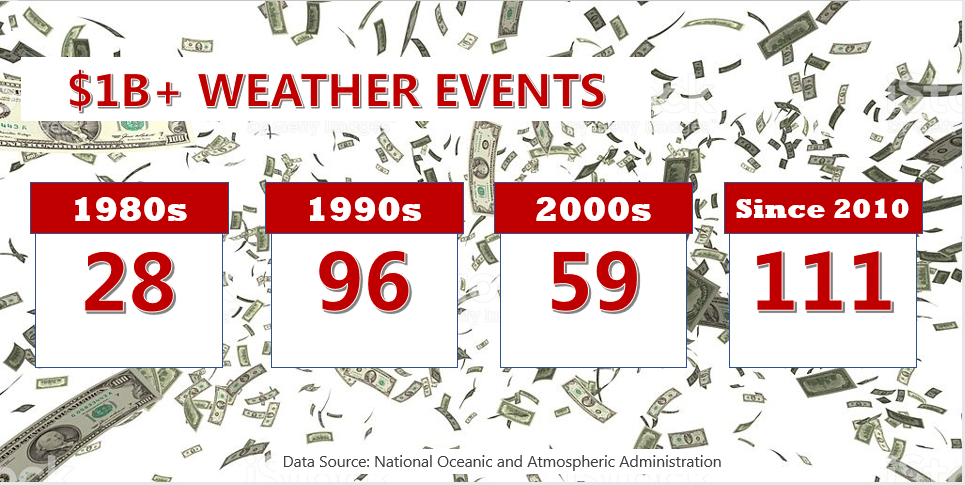
Adjusted for inflation, billion-dollar damage events are steadily increasing. There have been 250 such events since the 1980s and nearly half of them have occurred in the current decade. The data in the graphic below does not include any events from this year and there are many, including Hurricane Dorian, central U.S. spring floods, and severe winter storms.
It is not business as usual
What does this mean for business? The cost is going up! In the 1980s, extreme weather events caused $172 billion in losses (adjusted for inflation). So far this decade, losses are $761 billion and this does NOT include the multitude of events so far this year.
The increase in extreme weather events is clearly linked to climate change. The frequency and/or intensity of impactful events have been trending upward for hurricanes, flood events, severe winter storms, wildfires, and severe weather. When analyzing the aggregate of these events, the trend this decade compared to the past few decades has NOT been increasing in a linear fashion, but rather an exponential one.
According to a study by the Office of Homeland Security, the projected U.S. economic loss as a result of increasing weather volatility will be $1.2 trillion through 2050. On a global basis, the risk is staggering. By 2030, climate volatility is projected to cost the global economy $700 billion annually according to the Climate Vulnerability Monitor.
The word is getting out. Around 90% of companies in the S&P global 100 index have identified extreme weather as a current and future business risk. The enhanced volatility is the new normal.
The link
In general, the most sophisticated computer models have accurately forecasted the rise in global mean temperatures; the macro forecast has performed well. The models have not done a good job predicting regional volatility and the dramatic increase in impactful weather events; the micro forecast has not captured what has occurred on a regional basis. These are the issues that impact daily operations in logistics divisions and supply chain management around the globe.
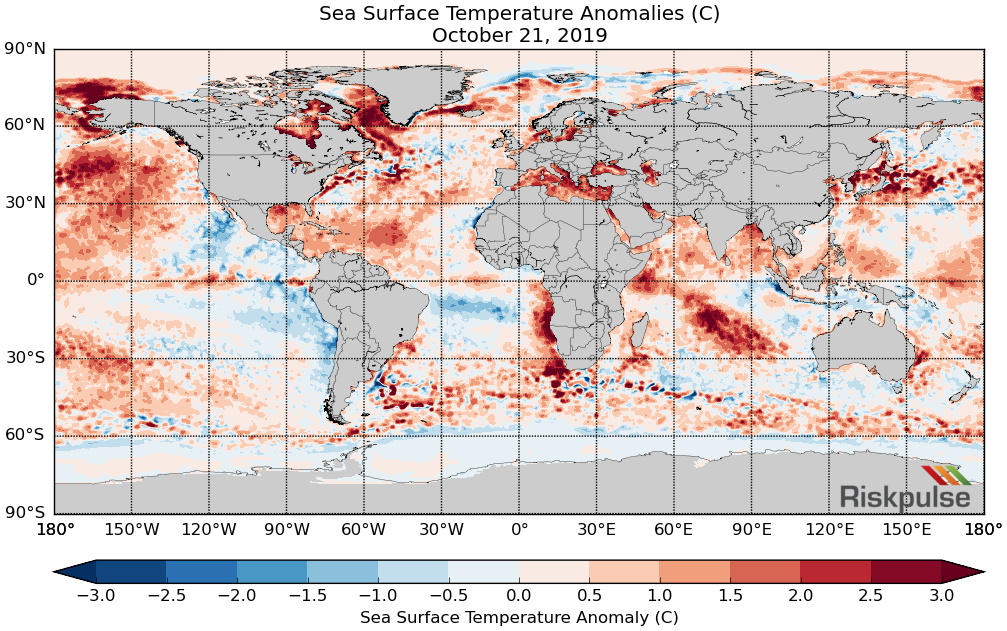
The crux of the increase in weather volatility on a global scale lies within the oceans. Below is a map that portrays the sea surface temperature (SST) anomalies around the globe. These anomalies are based on a 30-year average. Areas in red depict SSTs that are above normal while areas in blue are below normal (degrees C). This map shows anomalies for a specific day (October 21) but the trends have been the same for years. The world’s oceans are much warmer than they used to be.
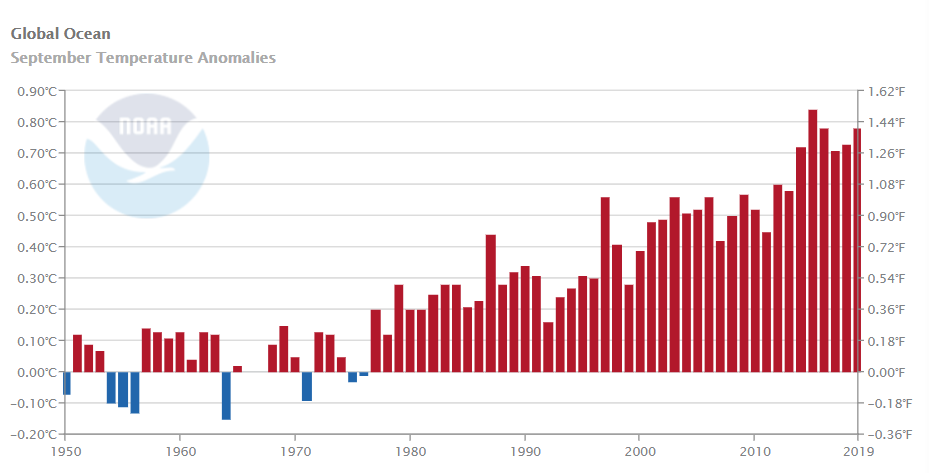
Since the middle of the last century, ocean temperatures have been warming, and for the past 25 years or so they’ve been warming twice as fast. The graph below depicts the trend in global ocean temperatures for every September from 1950 up to this year. September 2019 featured the 2nd warmest SSTs in the historical record; September of 2015 was the warmest. September is not special. Any time-frame one selects (months, seasons, years, decades) tells the same story.
Why is this important? Changes in the oceans (water covers nearly ¾ of the globe) drive the events that impact people, infrastructure, transportation, business, and life every single day.
This is the basic science of thermodynamics. By definition, thermodynamics deals with the transfer of energy from one place to another and from one form to another. When the oceans change temperature on a large scale, the output of how moisture and heat are circulated/transferred changes through the global system. These are some of the impacts:
- Tropical storms (hurricanes, typhoons, and cyclones) have more available energy to develop and rapidly intensify. In the Atlantic Basin, this is the 4th consecutive year with a Category 5 storm (winds in excess of 156mph) which is the first time in recorded history this has occurred
- The number of flood events has steadily increased in virtually all sections of the globe. As the oceans warm, so too does the amount of precipitable water (water vapor) that eventually makes its way back to the surface in the form of heavy rain events
- Non-tropical storms have shown an increase in intensity, especially in winter. Enhanced baroclinicity and more available atmospheric moisture fuels storms to higher levels such as the recent increase in “bomb cyclones” in the central U.S.
The increase in the sheer number of extreme events and the increase in volatility in virtually all spectrums can be linked to the changes in the global oceans. The billion-dollar question, or should we say the trillion-dollar question, is do the trends continue? The answer is largely a function of whether the oceans continue to warm at the same rate. Virtually every credible study indicates that the global oceans will continue to warm. There are differences in the rate of warming with some slopes steeper than others. As long as the oceans continue to warm, there is a high likelihood that the weather volatility will also continue to rise.
At Riskpulse, we have been working with some of the world’s largest and most innovative manufacturers to help with practical solutions to deal with increasing climate volatility. Solutions range from optimizing refrigeration use in logistics, to improved planning for over the road fleets ahead of significant events, to supply chain network risk visibility.
Riskpulse serves customers such as Honda, Unilever, NASA, Apple, Humana, Delhaize, 7-Eleven, Transplace, and AB-InBev. We are at the forefront of practical solution provision for both planning mitigation and operational execution for the systemic global changes that all supply chains will need to adjust for, as climate volatility continues/increases.
Related post

What Is a Risk Management Plan?
The Need for a Supply Chain Risk Management Plan What a year 2020 was for supply chains. No wonder more companies are going beyond supply…

Using Supply Chain Predictive Analytics to Reduce Risk
Supply Chain Predictive Analytics and Customer Service Service. It’s the difference between an average company and one that stands out from the rest. Forbes reports…
How to Mitigate Risk in The Supply Chain
The Supply Chain Risk Management Assessment A Deloitte Touche Tohmatsu survey found that 85 percent of global supply chains experienced at least one disruption in…