
2016 Summer Weather Outlook
By Jon Davis, Mark Russo, Dave Margolin, & Eric Adamchick
The past six months have featured an incredible amount of weather extremes. In the U.S., the most impressive items include:
- The warmest winter in recorded history (122 years)
- Severe flooding in portions of Texas, the Ohio Valley, and the Delta States
- Record single storm snow accumulations along the East Coast via the January blizzard
- The strongest stratospheric warming event (early March) recorded in the satellite era; this was preceded by the strongest Polar Vortex (PV) ever recorded during the heart of winter over the Arctic
- One of the coldest air masses of the past five decades to move into the Northeast U.S. over the President’s Day weekend; NYC (Central Park) recorded its first sub-zero temperature in over 20 years (Jan 1994 was the last occurrence) – during the warmest winter ever recorded!
The extremes were not confined to the U.S. If anything, the Global statistics were even more impressive:
- 2015 was the warmest year ever recorded
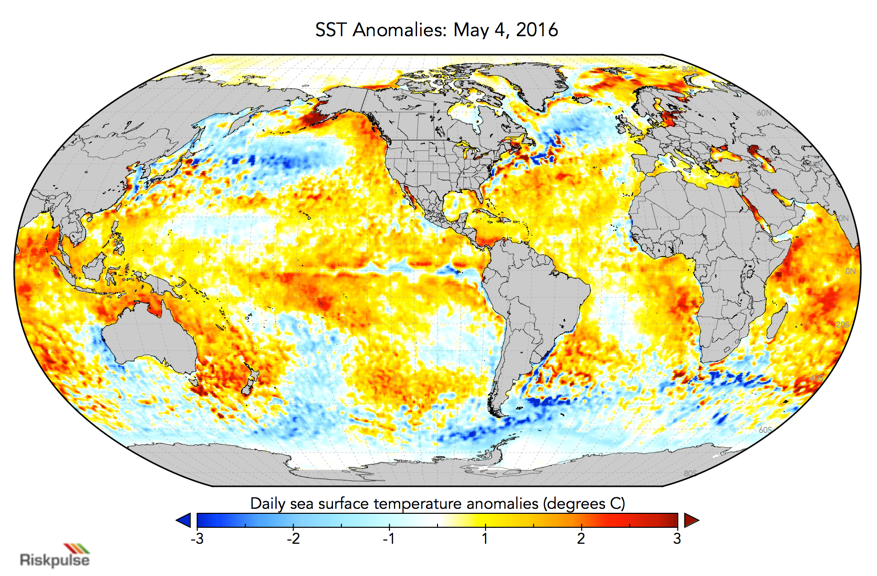
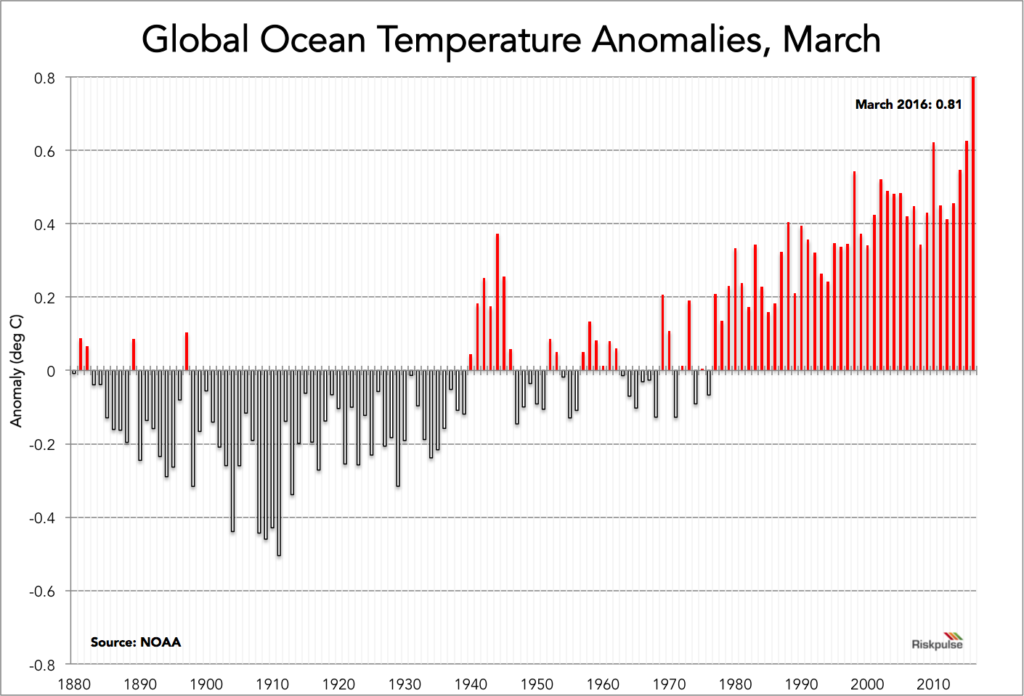
- Global sea surface temperatures (SSTs) have broken warm records for 12 consecutive months – please see the graph below of March SSTs
- Globally, April SSTs had the largest spatial extent of over 30 degrees C waters ever observed at 32 million sq. km, which compares to the April normal of 3 million sq. km.
- The 9 highest monthly temperature departures from normal in either direction, within the 137-year historical record, all occurred in the past 9 months; all are in the warm direction
- The El Nino event ranked among the strongest, if not the strongest event in the historical database
- Arctic Sea ice reached its lowest levels ever recorded during the past winter
Will the “era of extremes” continue over the upcoming summer? Which areas of the nation are most likely to be the warmest? The coolest?
Summer Outlook Overview
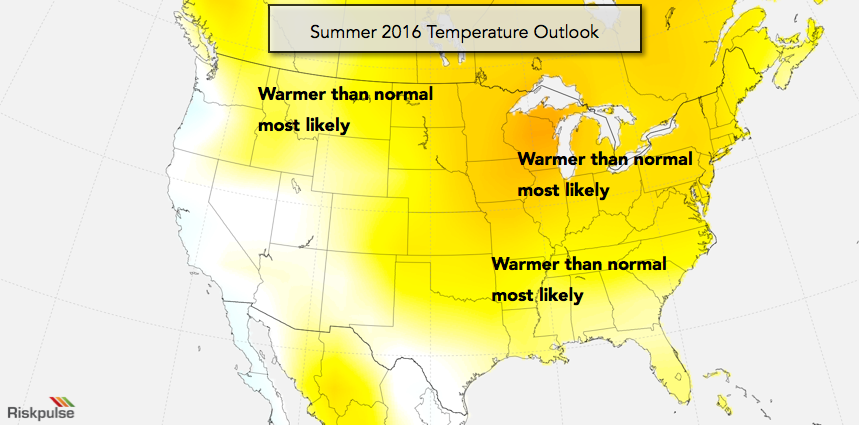
Our research points to a hotter summer, basis climatology, for the U.S. as a whole. More specifically, we believe that temperatures this summer will exceed both the 10/30-year normals. In other words, the probabilities for heat risks are skewed higher going into the summer across the U.S. Our reasons for this outlook include:
- Summer temperature trends
- El Nino to La Nina transition (ocean and atmosphere)
- Global sea-surface temperature (SST) configuration
- Spring snow and ice cover and soil moisture conditions
- Computer model guidance
The most likely time frame for more widespread, anomalous heat would be July-September compared to May and early June. The favored higher risk zones for more frequent or sustained heat are unknown at this time. The least favored region for more frequent or sustained above normal temperatures is the Southwest. The weather trends over the next 4-6 weeks, namely changes in SST configurations and establishment of summer patterns, will be important to monitor in helping decipher the regionality of these higher heat risks.
As a result of our summer forecast, notable potential impacts in the agriculture, energy, and supply chain / logistics sectors include:
- Increased risk of heat stress to summer crops (corn, soybeans, and spring wheat)
- Increased risk of heat stress to livestock (beef and dairy cattle, hogs, chickens)
- Increased risk of extreme heat impacts on the movement of perishable food and beverage products
- 80% probability of U.S. population-weighted May-September cooling degree days (CDDs) registering above the 10-year normal
Read below for sector-specific highlights. For the full report, which includes an in-depth analysis of the variables that drive this forecast, please contact us.
Sector Impacts
The key to agricultural production in the U.S. is atmospheric conditions (temperatures and rainfall) during the prime development periods. For the summer crops, these key periods are July for corn (pollination) and August for soybeans (pod development). While these are the most important periods, yield potential is not fully determined in the middle of summer. Even the preceding winter can have some impact on yield potential. The past winter was one of the warmest ever recorded in the Midwest as well as the country. Warm winters lead to an increased risk of insect infestation, soil compaction, higher evaporation rates throughout the winter and spring due to the lack of permafrost, and a higher incidence of weed/disease issues. These initial conditions simply increase the risk at the onset of the season.
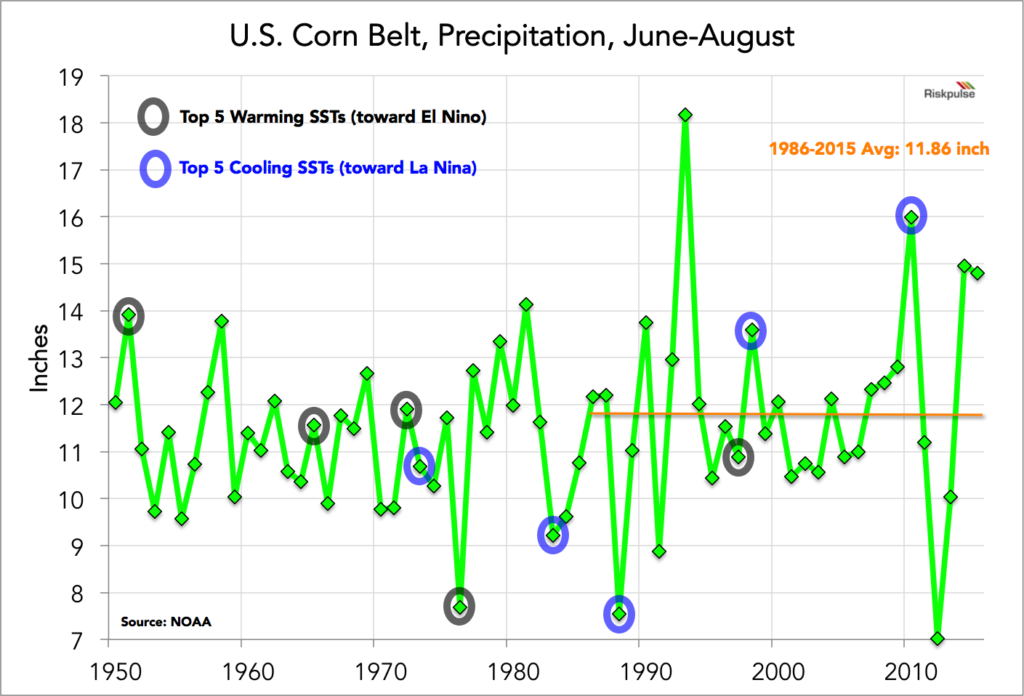
As for the critical summer development periods, there is no question that the risk probabilities this year are skewed higher than climatology especially in terms of heat. This is the opposite of last year when the risk probabilities were skewed lower. Some of this has to do with the El Nino to La Nina transition. The same trends that showed up across the lower 48 also show up for the Midwest corn and soybean belt – the most concentrated row crop area in the lower 48. Below is the chart of summer temperatures (June – August) specifically for the Midwest Corn Belt. Highlighted are the top 5 years of warming SSTs and cooling SSTs in the equatorial Pacific since 1950.
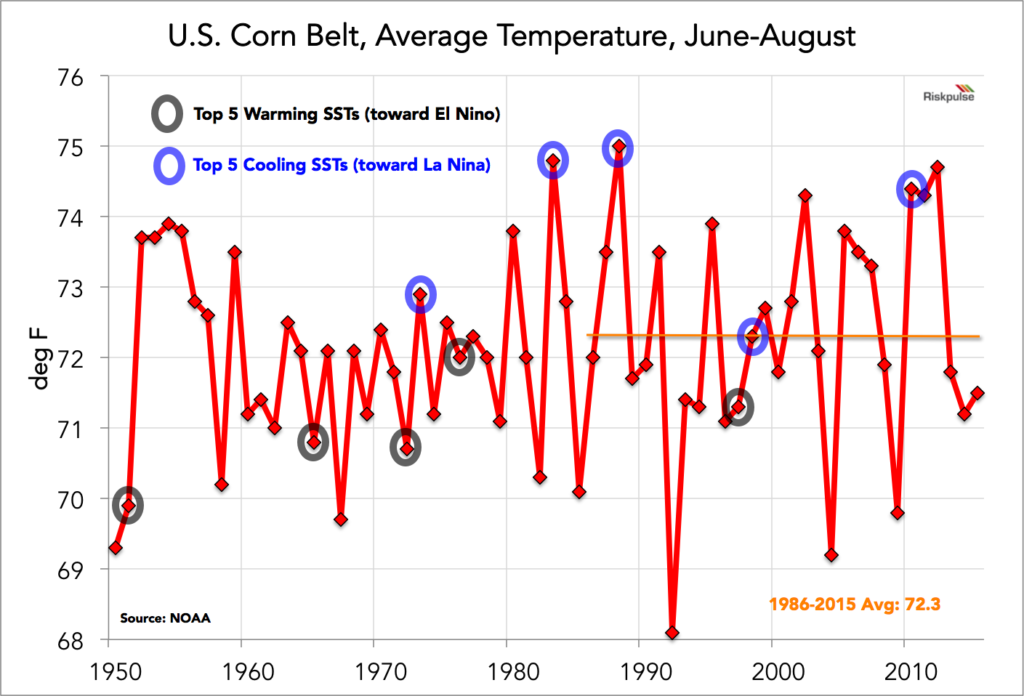
In years that featured a significant cooling of water temperatures in the equatorial Pacific, there is a distinct bias for warmth; the opposite is true for years with warming SSTs. Of this set of years, some are slightly above normal, which is not a significant issue, while others are some of the warmest in the historical record. Hence, this does not mean there is going to be a major problem in the Midwest. What it means, is the probabilities for heat are skewed higher going into this summer which is the opposite of a year ago.
Also included below is the distribution of rainfall in the Midwest during these warming/cooling SST years. The conclusion on the rainfall side is much more arbitrary which is a common theme due to the more regional/micro/scattered nature of rainfall.
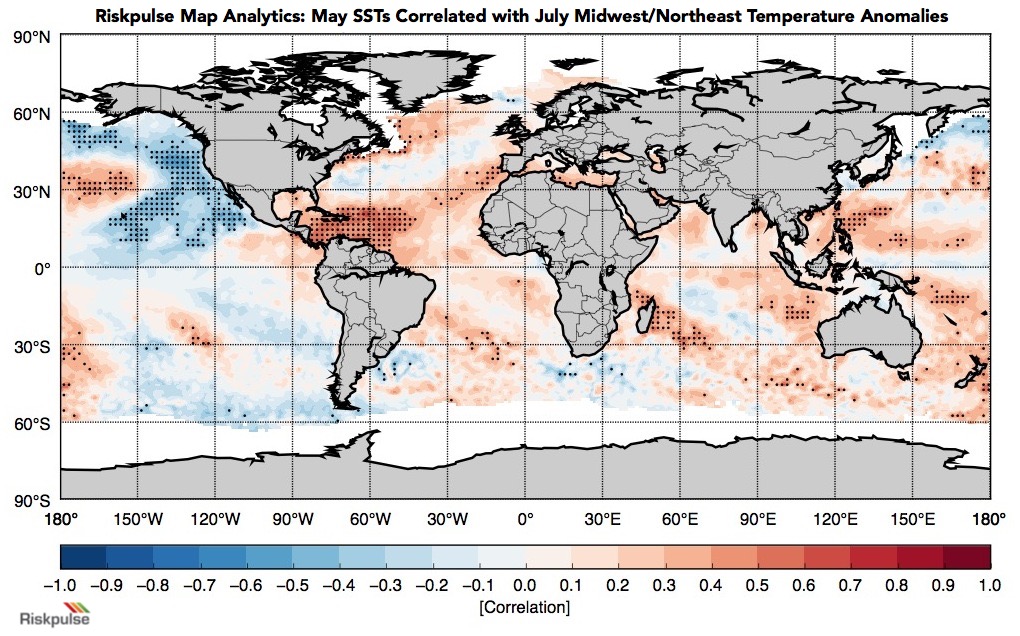
The initial conditions going into the season feature a higher probability of stressful weather during the summer compared to climatology. This is especially true in terms of heat. Whether the probabilities increase or decrease as we approach the critical July/August period is largely a function of our map analytics below. This map portrays the statistical correlation between SSTs in May and temperatures in July in the Midwest/East region. All areas that are highlighted with dots are statistically significant. Thus, warmer than normal SSTs in the Caribbean in May are correlated with above normal temps in July in the Midwest/East. Currently, water temperatures in the Caribbean are well above normal.
The other area that is important in determining the atmospheric setup is in the eastern North Pacific. Since this is a negative correlation, below normal SSTs off the West Coast of North America are correlated with heat in the Midwest/East. Currently, the SST “configuration” is not conducive for above normal temperature readings in the Midwest. Changes in this area during the next 4 to 6 weeks will be crucially important in determining whether the risk of heat in the Midwest is increasing or decreasing from the established “base state.”
In stating the obvious, how patterns evolve and become established during the early portion of summer (in and around the solstice – June 21) are critically important in how things will play out during the mid-summer growing period – July and August. The establishment of these patterns will inevitably determine what regions of the Nation are impacted/not impacted by heat and/or dryness.
The main global takeaway is for increased heat/dryness risks in the more northerly latitude ag belts including the Northern U.S., Canada, Europe/Russia, and northeast China. The last time we had an El Nino to La Nina transition was summer 2010 which was the Russian drought summer. We are not saying that there will be crop issues in every one of these areas; however, with a hotter summer forecast globally, the risk of heat-related issues with temperature-sensitive crops (i.e. corn) is skewed to the higher side in these mid-latitude crop belts.
Elsewhere, the risk for heat is reduced for sub-tropical ag belts including India, Indonesia, Malaysia, Thailand, Vietnam, and southern China. In fact, there is an increased risk of wetness issues including flooding in these ag belts over the next few months. For example, major flooding hit southern China during the summer of 1998. The La Nina transition along with a record warm Indian Ocean favors an invigorated summer monsoon rainy season compared to last year across South Asia and Southeast Asia and if anything, increases the likelihood of above normal rainfall.
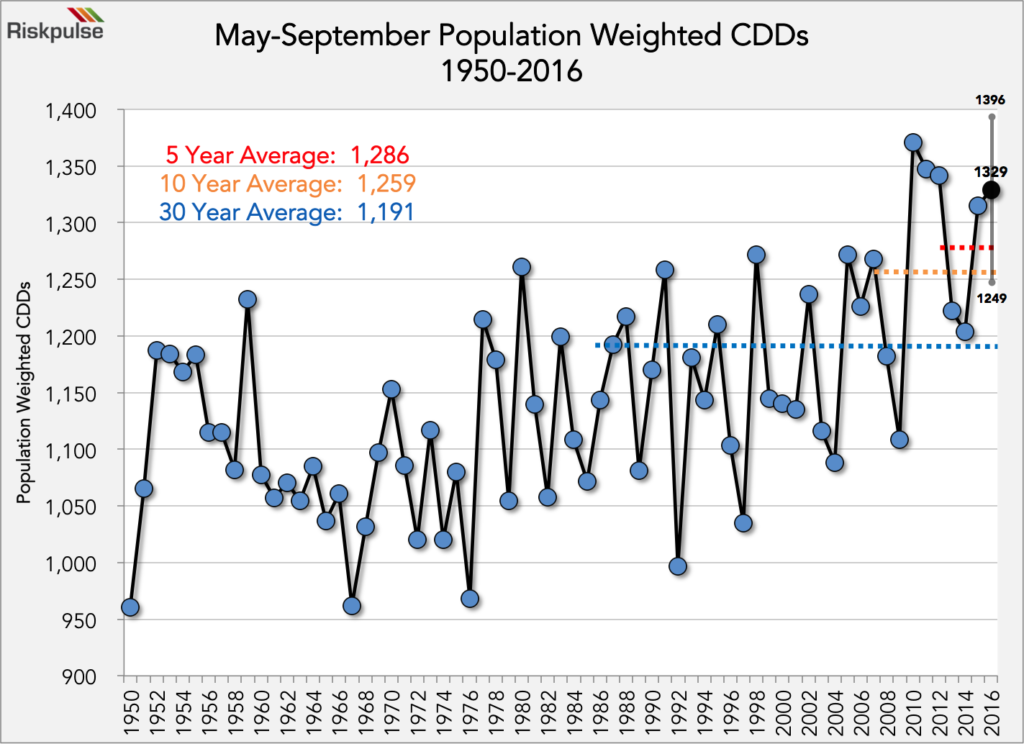
The overwhelming theme this summer is heat which equates to heightened cooling demand/power generation. As for the seasonal details, notable potential energy impacts (Maty to September) include:
- 80% probability of U.S. population-weighted May-September cooling degree days (CDDs) registering above the 10-year normal of 1,259 CDDs
- 25% probability of record high May-September U.S. pop-weighted CDDs
- May – September CDDs: 1,329 vs. 10/30-year normals of 1,259/1,191 and last year’s total of 1,315
While above normal temps are most likely across much of the country, the favored higher risk zones for more frequent or sustained heat are unknown at this time. The least favored region for more frequent or sustained above normal temperatures is the Southwest. The weather trends over the next 4-5 weeks, namely changes in SST configurations and establishment of summer patterns, will be important to monitor in helping decipher the regionality of these higher heat risks.
Tropics: A continuation of this dearth of Atlantic tropical activity in recent seasons is very unlikely this season due to the transition to La Nina along with the anomalously warm “Main Development Region” (MDR) in the Atlantic Ocean. Our current leaning is for normal to above normal tropical activity for the 2016 tropical season. The primary drivers for our forecast are elevated Atlantic SSTs and the ongoing transition from El Nino to La Nina.
Supply Chain & Logistics
The overwhelming theme for this summer is heat risk. The supply chain and logistics communities will be forced to keep a keen eye on the thermometer and increase awareness of heat exposure. There is a very high probability of frequent and more widespread heat waves across the lower 48, so teams must monitor higher-than-normal heat regions of the country (see heat map above) and take additional precautions to protect product along OTR and rail shipping lanes and product storage in warehouses and ports. This is especially true for perishable products such as produce, dairy, and beverages. Business continuity professionals should stay cognizant of excessive heat-related risk to ensure the health and safety of workers both inside and outside facilities throughout the season.
The Bottom Line
Based on our research, the overwhelming theme for this summer is heat. Of the variables we presented, as well as some we did not, the distribution of outcomes was distinctly in the warmer direction for the nation as a whole. Because of this, our confidence of the U.S. having a warmer than normal summer season is quite high.
As is always the case, precipitation forecasts are much more difficult, and thus, there is more uncertainty. As we progress thru the early portion of the season, regional rainfall trends will likely start to become established. This also includes the specifics on tropical activity which is always a function of atmospheric circumstance.
For the full report, which includes an in-depth analysis of the variables that drive this forecast, please contact us.
Related post

What Is a Risk Management Plan?
The Need for a Supply Chain Risk Management Plan What a year 2020 was for supply chains. No wonder more companies are going beyond supply…
Using Supply Chain Predictive Analytics to Reduce Risk
Supply Chain Predictive Analytics and Customer Service Service. It’s the difference between an average company and one that stands out from the rest. Forbes reports…

How to Mitigate Risk in The Supply Chain
The Supply Chain Risk Management Assessment A Deloitte Touche Tohmatsu survey found that 85 percent of global supply chains experienced at least one disruption in…