
2017 Hurricane Season Update
By Jon Davis, Mark Russo, & Eric Adamchick
Key Takeaways:
- The start of this Atlantic season has been impressive with five named storms recorded, although most have been very weak and very brief.
- Expect the remainder (and the heart) of the Atlantic Hurricane season to feature above normal activity in the Atlantic, Gulf of Mexico, and the Caribbean.
- Above normal tropical cyclone activity suggests there is an elevated risk of disruption to energy, agriculture, and logistics interests along the East Coast and the Gulf Coast.
- The primary factors favoring above normal tropical cyclone activity during the remainder of the Atlantic Hurricane season are the recent SST warming trend in the Atlantic basin, and the expected development of a low wind shear environment across the Atlantic.
Contact us today to receive on-demand, in-depth analysis from our team of meteorologists and prepare your business for the 2017 Atlantic Hurricane Season.
A Look Into The Heart Of The Atlantic Hurricane Season
The Atlantic Hurricane season officially kicked off June 1 and runs through November 30. This is the period of time in the Atlantic Basin (Gulf of Mexico, Caribbean, and Atlantic) when atmospheric and oceanic conditions are favorable for (or can support) tropical cyclone development. An average Atlantic hurricane season features approximately 11 named tropical storms, 6 hurricanes, and 2-3 major hurricanes of category 3 strength or greater. The figure above displays the breakdown of the Atlantic basin tropical cyclone climatology from 1966-2009 and the time of year these systems are most common. The sharp increase from August through September indicates we are now beginning the most active point in the Atlantic hurricane season (i.e. when the most intense storms are likely to occur).
It is also important to note that tropical cyclone activity is measured in accumulated cyclone energy (ACE)–the measure of the frequency, strength, and duration of all tropical cyclones within a given season. This is a metric we will use throughout this report and during the tropical season. The ACE is a more comprehensive assessment of the tropical cyclone risk to energy, agriculture, and logistics across the Gulf and East Coasts of the U.S. The graph below depicts the historical ACE values for the Atlantic Basin dating back to 1950, in which the current 30-year normal is 110.
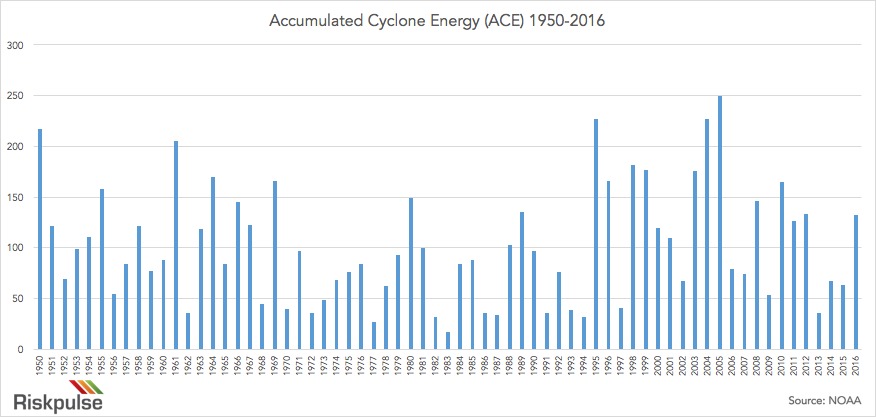
The start of this Atlantic season has been impressive with five named storms thus far, but most have been very weak and very brief. As a result, the ACE index as of August 3 is below normal with a value of 3.9 (compared to the normal of 8.2). Of the first five named storms of this season, the most notable was Tropical Storm Cindy. Cindy formed in the Gulf of Mexico in late June and moved northward, making landfall as a weak tropical storm along the Texas/Louisiana border on June 22. The main impacts from Cindy, were moderate to heavy rainfall along the Gulf Coast and some embedded tornadoes, which are not uncommon within the outer bands of tropical systems. Aside from Cindy, the other four named storms this season did not strengthen beyond a tropical storm. Emily was the only other system to make landfall in the U.S., which occurred near Tampa on July 31 as a very weak tropical storm. No notable impacts were recorded.
With the heart of the season still ahead (mid-August to early October is the core of the season with early September being the peak), the question now becomes, have atmospheric and oceanic conditions changed lately? Do these “base-state” conditions give any signals as we approach the core of the season? Has risk increased or decreased compared to earlier this summer? Let’s dive in.
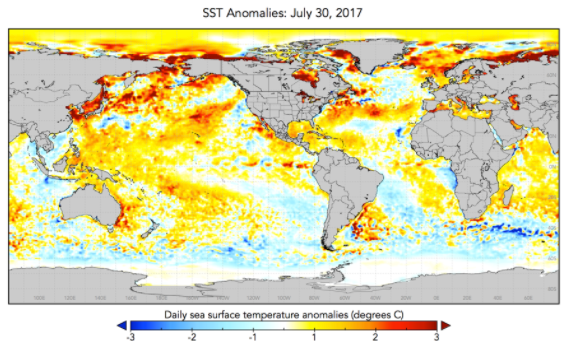
The figure below depicts global sea surface temperature (SST) anomalies. The general theme is warmer than normal SSTs across a majority of the global oceans. Tropical cyclones thrive over warm waters, so above normal SSTs are a favorable sign for tropical cyclone activity.
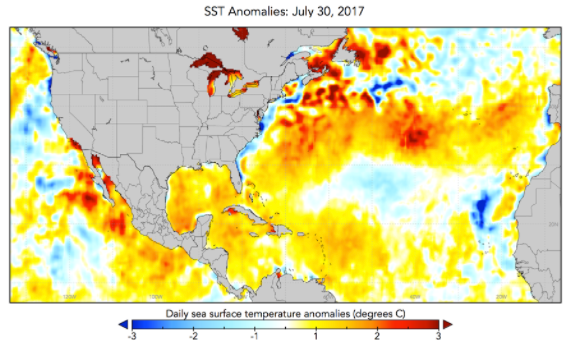
The figure below shows the current SSTs zoomed in on the Atlantic and Caribbean. Water temperatures are warmer than normal across the majority of these regions where tropical development is favored. Both the tropical Atlantic, or the main development region (MDR), is the pathway where tropical waves move off of Africa toward the Americas, and the waters over most of the Caribbean/Gulf of Mexico are nearing 1°C above the normal.
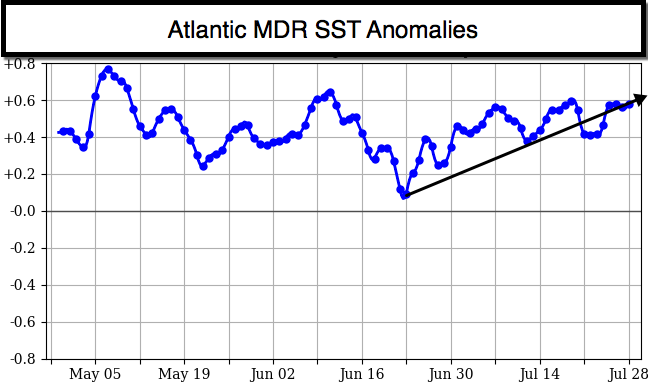
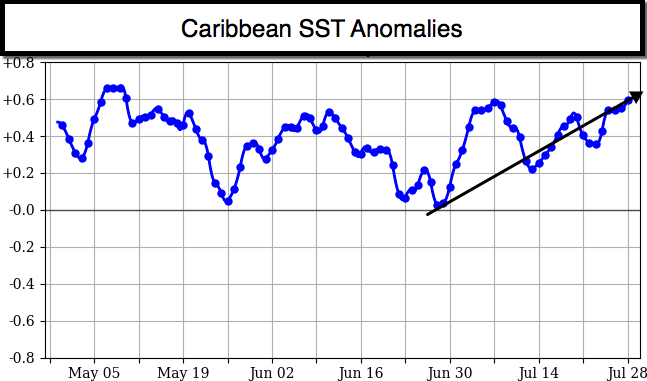
Below are graphs that further reinforce these trends. Each graph shows the daily SST anomalies averaged across the various locations. All 3 regions (The Caribbean, Gulf of Mexico, and tropical Atlantic/MDR) have featured a warming trend since the early part of the season. This warming trend makes the Atlantic basin more ripe for development of tropical systems and when they do form, there is a higher probability of more intense storms. This variable–SSTs in the Atlantic basin–has pushed the storm risk higher since the early portion of the summer.

The second key ingredient for tropical development is low atmospheric wind shear. Wind shear is how the wind direction and magnitude changes with height in the atmosphere, which ultimately can affect a tropical systems circulation. In order for a cluster of thunderstorms to develop into an organized rotating tropical cyclone, low wind shear is required. In other words, high levels of wind shear inhibit the rotation of tropical systems and therefore are not favorable for development or strengthening systems.
The figure below depicts the current wind shear across the Atlantic. The warmer shaded colors indicate high levels of wind shear, with the cooler colors indicating low wind shear.
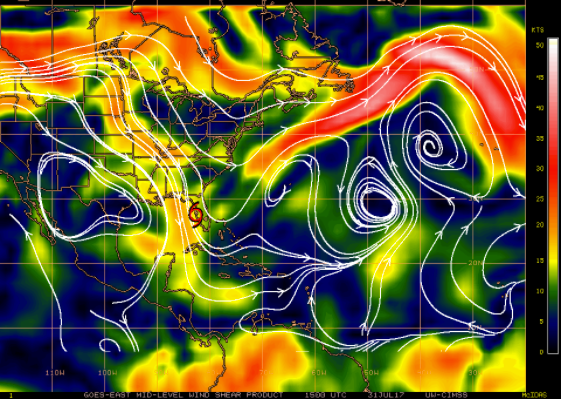
Across the MDR in the Atlantic ( between 10° and 20°N latitude) wind shear is rather low, which is currently favorable for tropical development. Further west, across the Caribbean and Gulf of Mexico, wind shear is a bit more variable but generally higher than in the MDR. Bottom line, the wind shear environment across the MDR is not likely to inhibit tropical development in the near future, while conditions in the Gulf of Mexico, in particular, are a bit less hospitable. While wind shear can change from day to day, we believe that wind shear should be in a relaxing mode as we head toward the heart of the Atlantic Hurricane season, which is a variable in favor of tropical cyclone development.
Given (1) the current warming trend in SSTs and (2) the expectation of a low wind shear environment across the Atlantic basin, we expect the remainder (and the heart) of the Atlantic Hurricane season to feature more activity than normal, meaning there is an elevated risk to energy, agriculture, and logistics interests along the East Coast and the Gulf Coast. We suggest taking steps now to equip your business to proactively respond to another active season.
Contact us today to receive on-demand, in-depth analysis from our team of meteorologists and prepare your business for the 2017 Atlantic Hurricane Season.
Related post

What Is a Risk Management Plan?
The Need for a Supply Chain Risk Management Plan What a year 2020 was for supply chains. No wonder more companies are going beyond supply…

Using Supply Chain Predictive Analytics to Reduce Risk
Supply Chain Predictive Analytics and Customer Service Service. It’s the difference between an average company and one that stands out from the rest. Forbes reports…

How to Mitigate Risk in The Supply Chain
The Supply Chain Risk Management Assessment A Deloitte Touche Tohmatsu survey found that 85 percent of global supply chains experienced at least one disruption in…